


Precision testing for peak performance.
Reveal what's really happening in your biology — so you can optimize with confidence, not guesswork.
Lab panel options:
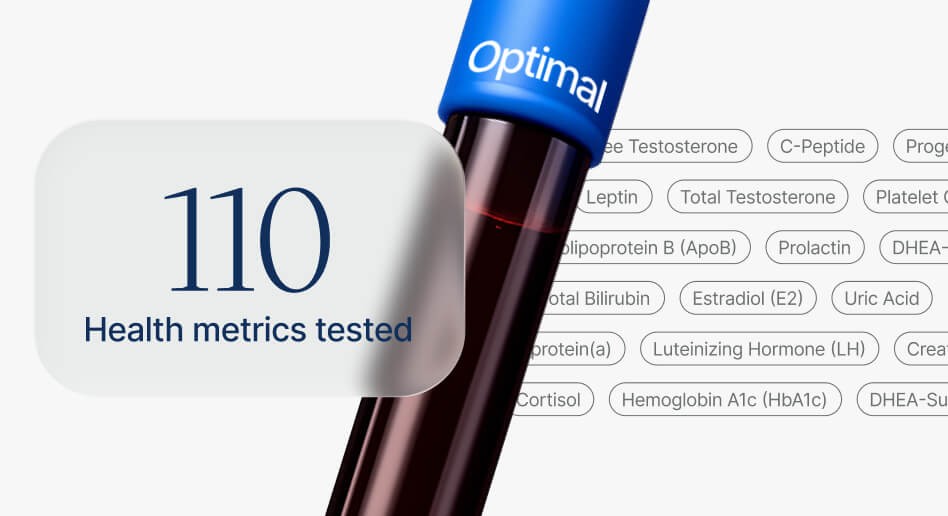
Optimal Panel
BEST FOR
Most people to get a high-definition view of their health plus expert guidance.
✓ Metabolic health metrics
✓ Cardiovascular function panel
✓ Complete hormone profile
✓ Thyroid function assessment
✓ Liver & kidney health
✓ Immune function indicators
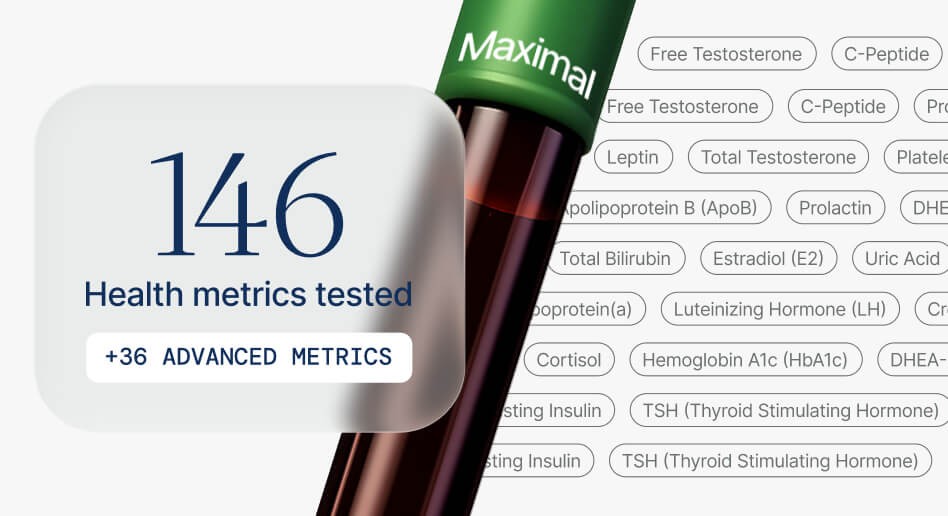
Maximal Panel
BEST FOR
People who want to upgrade with a deeper dive into their health data with additional metric testing.
Everything in Optimal, plus:
✓ Advanced inflammatory metrics
✓ Detox capacity assessment
✓ Healthspan metrics
✓ Deeper hormone insights
✓ Extended cardiovascular panel
✓ Auto-renews to Optimal panel (unless otherwise selected)
Add mid-plan check-ins: After completing your baseline, you can choose to track progress with additional tests, including our Essential Panel that measures 73 curated health metrics focused on key hormones and lipids. Available for a one-time fee of $99.99.


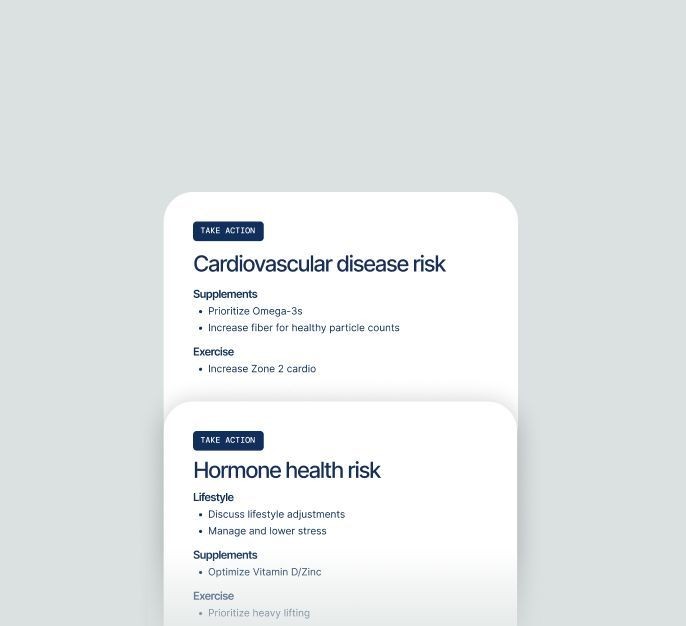
Personalized recommendations.
Receive action plans and protocol suggestions based on your unique results.

Decode your results.

How they affect your health

What your scores mean

Importance of each health metric


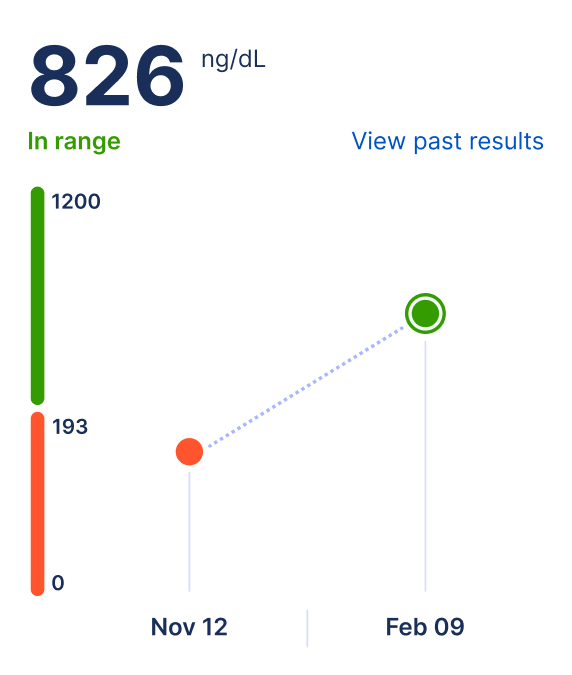
Track your progress.
Monitor changes over time with customizable mid-plan follow-up tests and annual baselines. See your options when you sign up.
What we test
Our panels cover 8 essential areas of health. Click a category to see specific health metrics and which panel includes them.


Transferrin molecules carry iron through your bloodstream to cells that need it for energy production and oxygen transport. This saturation level shows what fraction of your iron transport capacity is currently in use.
Basophils contain concentrated stores of histamine and inflammatory chemicals released during allergic reactions. These rare cells make up less than one percent of circulating white blood cells in healthy individuals.
Counting actual basophil numbers reveals more than proportions because these cells are so scarce normally. Small absolute changes can signal allergic conditions or bone marrow disorders.
Both enzymes leak from damaged muscle, but only AST also comes from liver. Comparing them helps determine whether elevated AST originates from muscle injury or liver disease.
Specialized white blood cells that combat parasitic infections and participate in allergic responses. The percentage reflects their proportion relative to all white blood cells.
The actual number of eosinophils per microliter of blood. Provides a more precise assessment than percentage, revealing your true eosinophil levels independent of other cell fluctuations.
Your body stores iron inside ferritin molecules that can hold thousands of iron atoms safely. Small amounts leak into blood, and measuring ferritin level reflects total body iron stores.
Relating iron stores to hemoglobin production helps distinguish different anemia types. This comparison reveals whether adequate iron is available for red blood cell formation.
Folate drives DNA synthesis and methylation reactions throughout your body. Deficiency affects rapidly dividing cells most, particularly bone marrow and developing fetuses.
Measures the percentage of blood volume occupied by red blood cells. Testosterone stimulates red blood cell production, so men typically have higher levels. Dehydration and testosterone therapy can elevate hematocrit.
The oxygen-carrying protein in red blood cells that delivers oxygen throughout your body. Hemoglobin concentration determines your blood's oxygen capacity and directly affects energy levels and exercise tolerance.
Iron circulates bound to transferrin protein because free iron generates harmful oxidative damage. Measuring serum iron captures a snapshot of iron in transit between storage and utilization.
Both enzymes leak from damaged tissues but in different proportions depending on the tissue. Comparing them helps identify the source of elevation.
Elevated LDH with low hemoglobin suggests red blood cells are breaking down abnormally. This pattern prompts investigation for hemolytic causes of anemia.
White blood cells providing targeted immune responses, including T cells, B cells, and natural killer cells. The percentage reflects lymphocytes relative to all white blood cells in circulation.
Total lymphocytes per microliter of blood, encompassing T cells, B cells, and natural killer cells. Reflects your actual immune cell reserve and capacity to mount adaptive immune responses.
Average mass of hemoglobin per red blood cell. Reflects how much oxygen-carrying protein each cell contains. Low MCH indicates cells lacking adequate hemoglobin; high MCH indicates cells packed with more.
Measures how densely packed hemoglobin is within each red blood cell. Indicates whether cells are optimally filled with hemoglobin. The most stable red cell index, rarely varying outside normal range.
Average size of red blood cells. Classifies anemia as microcytic (small), normocytic (normal), or macrocytic (large) to guide diagnosis. Size patterns point to specific deficiencies or conditions.
This calculation distinguishes iron deficiency from thalassemia trait, both common causes of small red blood cells. The different patterns reflect different underlying mechanisms.
The largest white blood cells, serving as precursors to tissue macrophages that engulf pathogens and debris. The percentage reflects monocytes relative to total white blood cells.
Number of monocytes per microliter of blood. These cells mature into macrophages that provide pathogen engulfment, antigen presentation, and tissue repair throughout your body.
Average size of platelets. Younger platelets are larger and more active. MPV provides insight into platelet turnover dynamics — elevated MPV often indicates increased platelet production or consumption.
The most abundant white blood cells, providing first-line defense against bacterial and fungal infections. A high percentage indicates neutrophil-predominant response typical of bacterial infections.
Number of neutrophils per microliter, representing your reserve of bacterial-fighting cells. Indicates your capacity for immediate antibacterial defense. Low counts significantly increase infection risk.
Comparing platelet count to platelet size may reflect bone marrow response to platelet destruction. Larger platelets suggest increased production to replace losses.
Small cell fragments that help your blood clot and stop bleeding. Platelet count reflects the balance between bone marrow production and consumption. Low levels increase bleeding risk; elevated levels may indicate inflammation or other conditions.
Number of red blood cells per microliter of blood. Reflects bone marrow production balanced against losses. Works with hemoglobin and hematocrit to assess your overall oxygen-carrying capacity.
Quantifies how much red blood cell sizes vary. Normal production creates uniform cells with low RDW. High RDW indicates unequal cell sizes from nutritional deficiency, mixed deficiency states, or bone marrow stress.
This ratio combines red cell distribution width and platelet count as a prognostic marker. It's been studied particularly in liver and cardiovascular disease.
This measures your blood's maximum iron-carrying capacity. Your liver makes more transferrin when iron is low to capture every available atom.
Interpreting transferrin saturation with ferritin characterizes iron status more completely. Different pattern combinations indicate different iron disorders.
B12 enables DNA synthesis and maintains nerve function. Your liver holds years of B12 reserves, which is why deficiency develops slowly despite tiny daily requirements.
Total white blood cells per microliter, including neutrophils, lymphocytes, monocytes, eosinophils, and basophils. Reflects overall immune activation. Elevated counts indicate infection, inflammation, or stress response.
Assesses the balance between atherogenic particles and protective cholesterol transport. A lower ratio indicates better cardiovascular protection by integrating particle count with cholesterol efflux capacity.
This calculation captures whether your lipid pattern favors artery-clogging particles. Higher values indicate smaller, denser LDL particles that penetrate vessel walls more easily.
Total cholesterol divided by HDL captures the balance between cholesterol delivery to tissues and cholesterol removal by reverse transport. This simple calculation predicts cardiovascular risk better than either number alone.
Cholesterol travels through blood inside protein particles because it can't dissolve in water. Your body uses cholesterol to build cell membranes, manufacture hormones, and produce vitamin D despite cholesterol's reputation as purely harmful.
This calculation estimates the number of atherogenic particles from standard lipid values. Particle number predicts cardiovascular risk better than cholesterol content alone.
HDL particles collect excess cholesterol from arteries and transport it back to the liver for disposal. These particles also fight inflammation and prevent oxidation in vessel walls.
Your liver releases this protein when inflammatory signals circulate anywhere in your body. High-sensitivity measurement detects low-grade chronic inflammation relevant to cardiovascular and metabolic disease.
LDL particles transport cholesterol from liver to peripheral tissues. Problems arise when excess particles circulate too long and small dense particles penetrate artery walls to trigger plaque formation.
Estimates average cholesterol per atherogenic particle. Lower ratios indicate smaller, more numerous, more dangerous particles. Higher ratios indicate larger particles that may be less atherogenic for a given LDL level.
Comparing cholesterol delivery to cholesterol removal reveals net cardiovascular risk. This ratio captures the ongoing competition between deposition and clearance in your arteries.
This particle resembles LDL but carries an extra apolipoprotein(a) protein. Your genes determine your Lp(a) level, and lifestyle changes barely affect it.
High Lp(a) inflates measured LDL cholesterol because Lp(a) particles contain cholesterol. Subtracting Lp(a) contribution reveals true LDL.
Subtracting HDL from total cholesterol captures all potentially harmful particles in one number. This includes LDL, VLDL, and remnants that contribute to arterial disease.
Assesses cholesterol content per atherogenic particle. Lower ratios indicate smaller, cholesterol-depleted particles; higher ratios indicate larger particles. Helps characterize particle quality beyond simple cholesterol measurement.
Remnant cholesterol in triglyceride-rich particles contributes to arterial disease. Calculating remnants helps assess atherogenic risk beyond LDL.
Excess calories get packaged into triglycerides for storage. These three-fatty-acid molecules flood your blood after meals, requiring fasting for accurate baseline measurement.
Cancer tissue binds PSA differently than healthy prostate tissue does. Comparing free to total PSA uses this biological difference to help distinguish malignant from benign conditions.
This formula estimates unbound testosterone available to enter cells and activate receptors. Calculating free testosterone from total levels and binding proteins provides useful approximation when direct measurement isn't available.
Your adrenal glands release cortisol in response to stress signals from your brain. This hormone surges in early morning to prepare you for the day and declines toward evening in a predictable daily rhythm.
Your adrenal glands produce both muscle-building DHEA-S and muscle-breaking cortisol. Comparing these opposing hormones reveals whether your body leans toward anabolic or catabolic metabolism.
Adrenal production of this sulfated hormone creates a reservoir that tissues tap for testosterone and estrogen synthesis. The sulfate group extends its half-life, keeping blood levels stable.
In men, estradiol is produced through conversion of testosterone, primarily in fat tissue. Men need estradiol for bone health, brain function, and libido. The balance between testosterone and estradiol matters more than absolute levels.
Estrogen and progesterone balance shifts throughout the menstrual cycle. Comparing these hormones helps identify patterns associated with cycle irregularities and hormone-related symptoms.
Sex hormone binding globulin binds testosterone tightly, leaving only a fraction free to act on tissues. Dividing testosterone by SHBG estimates what proportion remains biologically available.
Comparing free testosterone to cortisol may better reflect true anabolic-catabolic balance because free testosterone is the biologically active form. Bound testosterone can't enter cells and activate receptors.
Pituitary hormone that stimulates sperm production in the testes. Elevated FSH indicates the body is working harder to stimulate production, often due to testicular dysfunction. Low FSH may indicate pituitary problems.
Growth hormone from your pituitary stimulates your liver to produce IGF-1. Measuring IGF-1 provides an indirect but stable assessment of growth hormone status.
Your IGF-1 level expressed relative to expected values for your age and sex. A Z-score of 0 is average; positive scores are above average, negative below. Enables meaningful comparison across ages.
A pituitary hormone that signals your testes to produce testosterone. Measuring LH alongside testosterone reveals whether low T stems from testicular or pituitary problems. Levels fluctuate throughout the day.
These two pituitary hormones balance differently in health and disease. Women with polycystic ovary syndrome often show disproportionately elevated LH compared to FSH.
High LH with low testosterone suggests testicular failure where the testes don't respond to pituitary stimulation. Low LH with low testosterone points to pituitary or hypothalamic problems.
Small amounts of progesterone from your adrenals and testes serve as raw material for making testosterone and cortisol. Your brain also converts progesterone into neurosteroids affecting mood and sleep.
Your pituitary produces prolactin for milk production but it also affects reproduction, immunity, and metabolism. Dopamine from your hypothalamus normally restrains prolactin release.
High prolactin suppresses testosterone production. Comparing them reveals whether excess prolactin contributes to low testosterone.
Most PSA travels bound to proteins but a fraction circulates free. Cancer cells release PSA in forms that bind more readily, leaving less free PSA.
A protein enzyme produced by prostate cells. Small amounts normally enter the bloodstream; elevations can indicate benign enlargement, inflammation, or cancer. The rate of change often matters more than absolute values.
A liver-produced carrier protein that binds testosterone tightly, making it inactive. Men with identical total testosterone can have very different free testosterone depending on SHBG levels.
Measures all testosterone in your blood, including both bound and free fractions. About 98% circulates bound to proteins while only 2% remains free. Provides the overall picture of testosterone production.
Testosterone builds muscle while cortisol breaks it down. Athletes track this ratio to monitor recovery and detect overtraining.
Most male estradiol comes from testosterone conversion by aromatase. Comparing these hormones reveals aromatase activity and overall androgen-to-estrogen balance.
Combining albumin, cholesterol, and lymphocytes into a single score assesses nutritional status. Lower scores indicate better nutrition while higher scores suggest depletion.
Combining CRP and albumin into a score quantifies systemic inflammation that affects cancer prognosis. Higher inflammation with lower albumin predicts worse outcomes.
Monocytes and lymphocytes represent innate versus adaptive immunity. Comparing their counts provides another inflammation and prognosis marker.
Comparing neutrophils to lymphocytes reveals systemic inflammation and immune balance. This ratio predicts outcomes across many disease states.
This ratio combines platelet and lymphocyte counts to create another inflammation and prognosis marker. It joins NLR in assessing immune-inflammatory status.
Combining albumin and lymphocytes assesses nutritional and immune status together. Lower scores indicate better nutrition and stronger immune function.
This calculation multiplies platelets by neutrophils and divides by lymphocytes, combining three immune-inflammatory markers. It serves as a prognostic indicator across conditions.
Lab technicians examine urine visually to detect changes invisible in chemical analysis alone. Cloudiness, unusual colors, or particles prompt closer investigation of what your kidneys are filtering.
Only processed bilirubin dissolves in water and can pass through kidney filters into urine. Detecting it signals that bile flow is obstructed and processed bilirubin is backing up into blood.
Your liver converts toxic ammonia from protein breakdown into urea for safe elimination. Measuring blood urea nitrogen reveals both how much waste your body produces and how efficiently your kidneys clear it.
Comparing these two waste products helps distinguish true kidney failure from dehydration or bleeding. They respond differently to various conditions, making their relationship diagnostically valuable.
Urine color varies from nearly clear when dilute to deep amber when concentrated. Yellow tones from urochrome are normal, but red, brown, or other colors signal possible bleeding, medications, or metabolic conditions.
Muscle metabolism constantly produces creatinine from creatine breakdown at a steady rate. Your kidneys filter it out efficiently, making blood levels a reliable marker of kidney function.
True filtration measurement requires impractical procedures for routine care. Estimated GFR uses creatinine and demographic factors to approximate kidney function through validated equations.
Glucose provides universal fuel that every cell burns for energy. Your pancreas releases insulin after eating to enable cells to absorb glucose and maintain blood sugar in a narrow range.
Your liver produces ketones from fat breakdown when glucose becomes unavailable for fuel. Small amounts during fasting are normal, but excessive accumulation creates harmful acidosis.
White blood cell enzymes released into urine signal infection. Detecting this enzyme activity provides rapid screening for urinary tract infection.
Bacteria converting nitrate to nitrite signal their presence in urine. This test specifically detects nitrite-producing bacteria like E. coli.
This test detects tiny amounts of blood invisible to the naked eye. Positive results may indicate red blood cells, free hemoglobin, or myoglobin.
Urine acidity varies based on diet, metabolism, and kidney function. Normal range spans from acidic to mildly alkaline depending on what your body needs to maintain blood pH.
Healthy kidneys filter massive volumes while retaining nearly all protein. Significant protein in urine signals damage to the filtration barrier.
Urine concentration varies with hydration from nearly water-like when dilute to much denser when concentrated. Specific gravity measurement quantifies this concentration.
Intestinal bacteria convert bilirubin to urobilinogen, most of which exits in stool. Small amounts absorbed back into blood normally appear in urine.
Albumin reflects liver function while globulins indicate immune activity and inflammation. Comparing these values reveals patterns that neither number shows alone about protein metabolism and immune status.
Liver function scoring using albumin and bilirubin provides objective assessment without subjective clinical measures. Lower scores indicate better liver synthetic capacity and bile processing.
Your liver produces more albumin than any other protein, creating the molecules that hold fluid in your vessels and transport hormones through blood. Low levels signal either reduced production from liver disease or excessive loss through kidneys or gut.
Liver and bone both release this enzyme when cells turn over or biliary flow slows. Elevated levels point to either bile duct obstruction or accelerated bone remodeling from growth, fracture healing, or metabolic bone disease.
A liver-specific enzyme released when liver cells are damaged or inflamed. Elevations typically indicate injury from fatty liver disease, medications, or toxins. Mild elevations are common with metabolic syndrome even before overt liver disease.
Rising liver enzyme levels combined with falling platelet counts suggest progressive scarring of liver tissue. This calculation estimates fibrosis severity without requiring a biopsy.
This enzyme handles amino acid metabolism in multiple organs including liver, heart, skeletal muscle, and kidneys. Elevated levels indicate cell damage somewhere but require additional context to determine the source.
Your liver processes bilirubin by attaching sugar molecules that make it water-soluble for excretion into bile. When bile flow stops, this processed bilirubin accumulates in blood and spills into urine, turning it dark brown.
Red blood cells break down after their lifespan ends, releasing hemoglobin that converts to bilirubin. Your liver then processes this pigment for excretion, and measuring total bilirubin reveals whether this system is working properly.
Liver diseases produce characteristic enzyme patterns based on whether hepatocytes are dying or bile flow is blocked. Comparing AST to ALT reveals which pattern predominates.
Different conditions produce different ratios of processed to unprocessed bilirubin. Measuring both forms helps distinguish obstructive causes from hepatocellular causes of jaundice.
This score combines multiple factors to estimate liver scarring without biopsy. It helps identify patients with significant fibrosis who need closer monitoring or treatment.
A liver enzyme particularly sensitive to alcohol consumption, often elevating before other liver markers. Helps clarify whether alkaline phosphatase elevation is hepatic or skeletal in origin. Also responds to certain medications.
GGT comes almost exclusively from liver while alkaline phosphatase exists in both liver and bone. Comparing them reveals whether elevated alkaline phosphatase originates from liver or bone.
Subtracting albumin from total protein leaves a diverse mix including antibodies, clotting factors, and transport proteins. This calculated fraction reflects both liver synthesis and immune system activity.
This calculation uses body measurements and liver enzymes to estimate fatty liver likelihood without imaging. Higher scores suggest greater probability of hepatic steatosis.
Comparing liver enzymes reveals whether injury is primarily to hepatocytes or bile ducts. Different ratios point to different disease patterns.
All blood proteins together include albumin plus hundreds of globulins. Albumin accounts for roughly sixty percent while globulins make up the rest.
Muscles store energy as creatine phosphate for instant use during intense activity. When muscle cells are damaged or stressed, this enzyme leaks into blood.
This calculation converts your A1c result into average glucose numbers matching what you see on your glucose meter. It translates a complex measurement into familiar units.
Countries outside the US report glucose in millimoles per liter rather than milligrams per deciliter. This conversion provides your estimated average glucose in international units.
Blood glucose measures the concentration of sugar circulating in your bloodstream. Glucose serves as the primary fuel for most cells, particularly the brain which depends almost exclusively on glucose. After eating, carbohydrates digest into glucose that enters the blood, triggering insulin release to move glucose into cells. Fasting glucose reflects baseline glucose regulation. The liver releases glucose between meals to maintain blood levels. Both high and low glucose impair function and can become dangerous at extremes.
Glucose attaches to hemoglobin molecules throughout red blood cell lifespan through glycation. Measuring glycated hemoglobin reflects average blood sugar over the preceding two to three months.
This calculation multiplies fasting glucose by fasting insulin to estimate insulin resistance. Higher values mean your pancreas must produce more insulin to control blood sugar.
Your pancreas releases insulin when blood sugar rises to enable cells to absorb glucose. Insulin shifts your body from burning fuel to storing it as glycogen and fat.
Nearly every tissue contains this enzyme that interconverts lactate and pyruvate in energy metabolism. Widespread distribution means elevation signals cell damage somewhere without specifying where.
Triglycerides and HDL move opposite directions as metabolic health changes. Dividing them creates a sensitive marker for insulin resistance and atherogenic dyslipidemia.
Multiplying triglycerides by glucose creates an insulin resistance marker. This index correlates with gold-standard insulin resistance measurement.
Adding BMI to the TyG index incorporates body composition. This refined calculation may improve metabolic risk prediction.
Purine breakdown produces uric acid as the final product. Humans lack the enzyme to break it down further, forcing kidneys to excrete it intact.
Comparing uric acid to creatinine helps assess whether high uric acid comes from overproduction or underexcretion. Different patterns point to different causes.
T3 directly activates nuclear receptors throughout your body to control metabolism. Most T3 comes from peripheral conversion of T4 rather than direct thyroid secretion.
Your thyroid makes mostly T4, which tissues convert to active T3 locally. Comparing these hormones reveals whether peripheral conversion is working properly despite adequate thyroid hormone production.
Comparing T4 to TSH helps characterize thyroid dysfunction. This ratio reveals whether thyroid and pituitary feedback loops are working properly.
Your thyroid secretes far more T4 than T3. T4 functions mainly as a reservoir that tissues convert to active T3 locally as needed.
Your pituitary releases TSH to control thyroid function through feedback loops. Falling thyroid hormones trigger more TSH while rising hormones suppress it.
Your blood maintains electrical neutrality by balancing positive and negative charges. Calculating unmeasured anions helps identify whether excess acids are accumulating and what type of metabolic problem might be present.
Calcium controls muscle contraction, nerve signaling, and hormone release while providing structural support for bones and teeth. Your body maintains tight control over blood calcium because both high and low levels cause serious problems.
When calcium multiplied by phosphorus rises too high, minerals start depositing in soft tissues instead of bone. This calculation warns of increased calcification risk in blood vessels and organs.
Chloride travels alongside sodium to maintain electrical balance in blood and other fluids. Beyond fluid regulation, chloride is essential for stomach acid production and carbon dioxide transport from tissues to lungs.
Metabolic panels measure bicarbonate under the label CO2 because labs measure total carbon dioxide content. Bicarbonate buffers acid in blood, and your lungs and kidneys adjust its level to maintain normal pH.
About half your blood calcium binds to albumin, so low albumin makes total calcium appear falsely low. Correcting for albumin reveals whether free calcium is truly abnormal.
Evaluating folate and B12 together prevents treating one deficiency while missing the other. Both cause similar anemia patterns but require different treatment approaches.
Red blood cell magnesium reflects intracellular status better than serum magnesium. Most body magnesium lives inside cells rather than blood, making RBC measurement more informative.
Phosphorus partners with calcium in bone and provides the backbone for DNA, RNA, and ATP. Your kidneys regulate phosphorus balance precisely.
Potassium concentration inside cells vastly exceeds outside concentration, creating electrical gradients essential for nerve and muscle function. Small changes in blood potassium cause serious heart rhythm disturbances.
Sodium concentration determines fluid balance throughout your body. Your kidneys adjust water excretion to maintain sodium in a tight range, triggering thirst when concentration rises.
Comparing vitamin D to inflammation explores their relationship. Low vitamin D often coexists with high inflammation, potentially indicating elevated health risk.
Genetic variants affecting this enzyme influence folate processing and homocysteine metabolism. Testing identifies mutations that may affect cardiovascular risk and pregnancy outcomes.
A hormone from fat cells that improves insulin sensitivity, reduces inflammation, and protects blood vessels. Paradoxically decreases as body fat increases. Low levels associate with insulin resistance and cardiovascular disease.
Measures protein components of lipoprotein particles. ApoB indicates atherogenic particles that deposit cholesterol in arteries; ApoA-I indicates protective HDL. Captures cardiovascular risk that standard cholesterol testing misses.
Evaluates insulin resistance through multiple markers including fasting insulin, glucose, and calculated indices. A composite score quantifies severity, capturing metabolic dysfunction earlier than glucose alone.
An enzyme produced by inflammatory cells within arterial plaque. Elevated activity indicates active vascular inflammation and unstable plaque. Specifically reflects what's happening in blood vessel walls, distinct from systemic inflammation.
An enzyme released during inflammation that damages vessel walls and oxidizes LDL. Elevated MPO indicates active vascular inflammation and predicts cardiovascular events independent of traditional risk factors.
A protein filtered by kidneys that provides more accurate kidney function assessment than creatinine, especially in elderly, malnourished, or very muscular individuals. May better predict cardiovascular outcomes.
A liver protein central to blood clot formation. Also rises during inflammation. Elevated levels increase blood viscosity, promote thrombosis, and independently predict cardiovascular events beyond traditional risk factors.
Measures glycated proteins reflecting average blood glucose over 2-3 weeks. Captures more recent glucose control than HbA1c and responds more quickly to treatment changes. Useful when conditions affect A1c accuracy.
A hormone from fat cells that signals the brain about energy stores and satiety. High leptin with continued hunger indicates leptin resistance — a marker of metabolic dysfunction linked to obesity.
LDL particles that have undergone oxidative modification, making them highly atherogenic. Triggers inflammatory responses that initiate atherosclerosis. Captures the actively harmful LDL fraction beyond standard measurement.
Screens for toxic metals including lead, mercury, and arsenic that can accumulate in the body and impair cognition, energy, and organ function. Identifies exposures from environmental, dietary, or occupational sources.
Screens for antinuclear antibodies associated with autoimmune conditions like lupus and Sjögren's syndrome. Positive results automatically reflex to identify specific antibody patterns for more precise diagnosis.
Screens for antibodies indicating immune reaction to gluten, including tissue transglutaminase and other celiac-specific markers. Helps diagnose celiac disease and gluten sensitivity affecting gut health and nutrient absorption.
Highly specific marker for rheumatoid arthritis, often detectable years before symptoms appear. Presence indicates autoimmune activity targeting joint tissue and helps distinguish RA from other forms of arthritis.
Measures how quickly red blood cells settle in a tube over one hour. Elevated rates indicate inflammation somewhere in the body. A nonspecific but useful screening marker for infection, autoimmune conditions, and chronic disease.
Antibodies targeting an enzyme essential for thyroid hormone production. Elevated levels indicate autoimmune thyroid disease such as Hashimoto's thyroiditis and predict risk of future thyroid dysfunction.
A gut bacteria metabolite produced when digesting red meat, eggs, and certain fish. Elevated levels associate with increased cardiovascular risk and may reflect gut microbiome composition and dietary patterns.
Mitochondria use this compound for energy production while it also scavenges damaging free radicals. Your body makes less CoQ10 with age, and statin medications further reduce production.
Copper serves as a cofactor for enzymes managing energy production, connective tissue formation, iron handling, and neurotransmitter synthesis. Your body tightly regulates copper because both deficiency and excess cause damage.
Essential B vitamin required for DNA synthesis, cell division, and methylation. Critical for producing red blood cells and regulating neurotransmitter production. Body stores only a few months' supply, making consistent dietary intake necessary.
Your thyroid concentrates iodine to manufacture thyroid hormones. Deficiency remains a leading cause of preventable intellectual disability worldwide despite being rare where salt is iodized.
Comprehensive assessment of iron status measuring circulating iron, your body's iron-carrying capacity, and iron stores. Identifies deficiency, overload, or impaired iron transport affecting energy and blood cell production.
Measures magnesium inside red blood cells, reflecting true tissue stores rather than transient blood levels. Essential for muscle function, energy production, nerve signaling, and hundreds of enzymatic processes.
A fat-soluble antioxidant that protects cell membranes from oxidative damage. Supports immune function, skin health, and cardiovascular protection. Deficiency is rare but can impair nerve and muscle function.
Essential mineral for energy production, bone formation, and cell membrane structure. Works closely with calcium to maintain skeletal health. Levels are regulated by kidneys, parathyroid hormone, and vitamin D.
Selenium powers antioxidant enzymes and supports thyroid hormone conversion. Selenium-containing proteins protect against oxidative damage throughout your body.
Vitamin A supports vision, immunity, and cell growth. Your liver stores substantial reserves making deficiency rare but toxicity possible with excessive supplementation.
Vitamin C fights oxidative damage and builds collagen for connective tissue. Humans must get vitamin C from diet because we lack the enzyme to make it.
Vitamin K activates clotting factors in your liver and proteins regulating calcium in bone and vessels. It's essential for both hemostasis and skeletal health.
How it works.

1
Choose your panel
Select Optimal or upgrade to Maximal based on how deep you want to go. Add specialized testing if you want targeted insights.

2
Schedule your test
Pick from 2,000+ lab locations near you.
3
Complete your draw
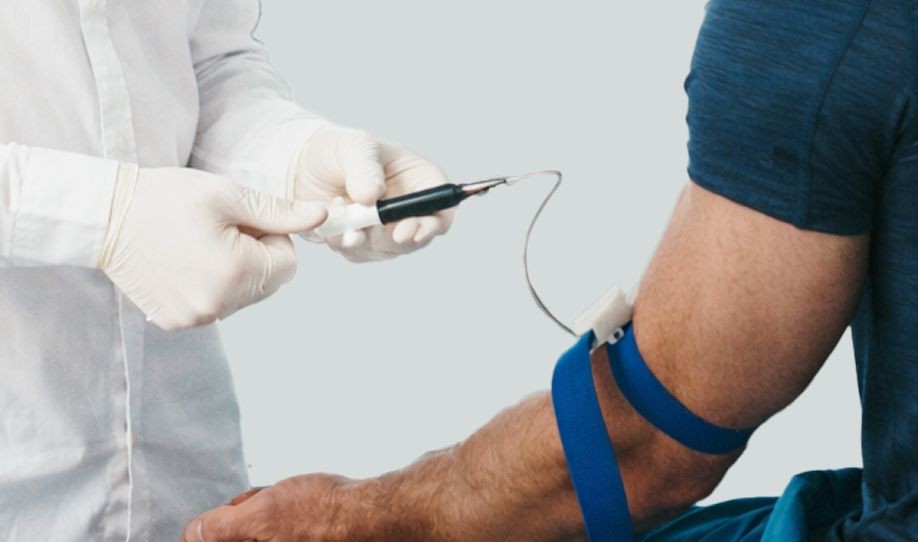
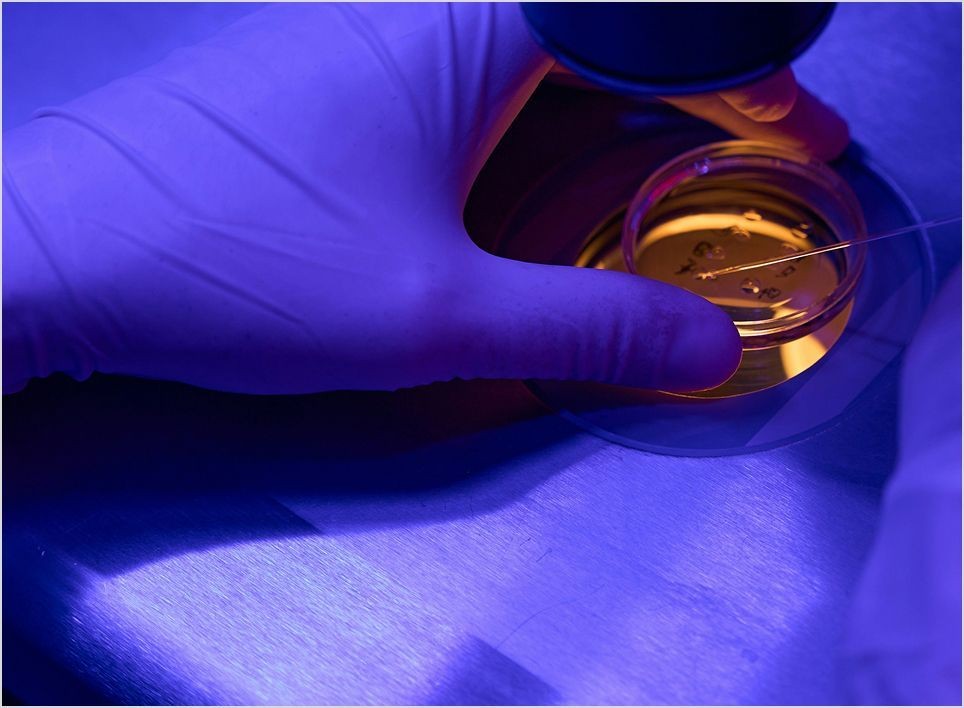
One simple blood draw — fasting required. Your samples go to certified labs for analysis.
4
Get your insights
Access personalized health scores plus protocol and lifestyle recommendations through your dashboard.
5
Track progress
Retest mid-plan or at your annual renewal – tiered options available. Learn health metric trends to continue your progress.
1
Choose your panel
Select Optimal or upgrade to Maximal based on how deep you want to go. Add specialized testing if you want targeted insights.
2
Schedule your test
Pick from 2,000+ lab locations near you.
3
Complete your draw
One simple blood draw — fasting required. Your samples go to certified labs for analysis.
4
Get your insights
Access personalized health scores plus protocol and lifestyle recommendations through your dashboard.
5
Track progress
Retest mid-plan or at your annual renewal – tiered options available. Learn health metric trends to continue your progress.
More than just numbers.
Your results come with expert context, meaning, and action steps.
Personalized health scores
Get precision scores for each health metric and see where there are opportunities to optimize.
Actionable guidance
Clear next steps for diet, exercise, sleep, and stress — based on what your data actually shows.

Protocol recommendations
Based on your data, learn about Maximus prescription protocols that help you achieve your performance goals.
On-demand access
Review your results anytime through our platform. Track changes over time as you test further and optimize.

The Maximus difference.
We're not just another lab testing company. Here's why our approach is unique.
Premium value + competitive pricing
Optimization, not sick care
Research-backed protocols
Connected to treatment
panel add-ons
Go even deeper with specialized testing.
Customize your data set with targeted panels for specific concerns. Add-ons are available for purchase at checkout and may require an additional blood draw.

Heavy Metals Panel
Screen for toxic accumulations affecting health and cognition.

Autoimmunity Panel
Deeper immune function assessment beyond standard metrics.
Methylation Panel
Genetic insights for personalized health and medication response.
Before you start.
varies by state
Check availability
Lab testing is available in 47 states. Not currently available in Rhode Island, New York, or New Jersey. Check back in as we add these states in the future.

Testing Requirements
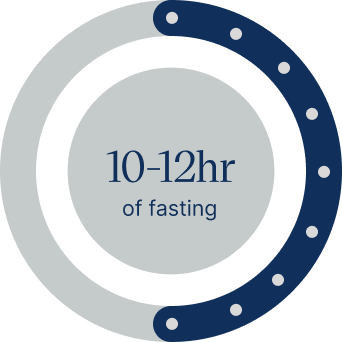
Blood draw prep
Blood draws require fasting (typically 10-12 hours). You'll also need to pause certain supplements before testing. We will send detailed instructions with your order.
Lab Testing FAQs
Do the lab panels include a doctor consultation?
At this time, this is a self-directed lab offering — your results do not include a physician consultation. However, everything is designed to be interpretable on your own, with clear optimal ranges and context for each marker developed by board-certified clinicians and laboratory scientists, plus personalized guidance on recommended health actions. We encourage you to share your results with your primary care physician if you'd like to discuss specific findings further.
What's the difference between the Optimal and Maximal panels?
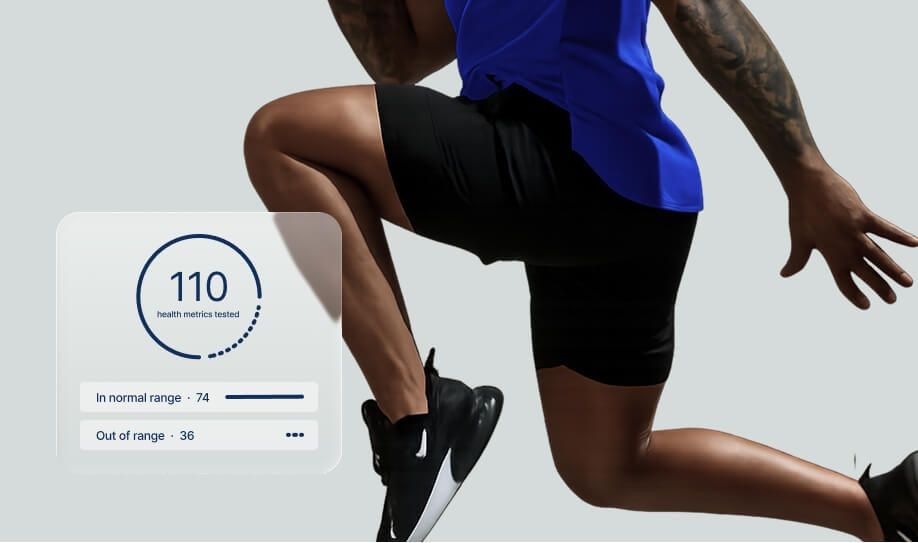
Optimal includes 110 health metrics covering metabolic health, cardiovascular function, hormones, thyroid, liver, kidney, immunity, and essential nutrients — everything most people need for a comprehensive baseline. Maximal is an upgrade and includes 146 health metrics — everything in Optimal plus 36 advanced markers for insulin resistance, deeper hormone insights, micronutrient status, inflammation, and healthspan indicators. Choose Optimal for a thorough foundation; choose Maximal if you want maximum visibility with no blind spots.
How often should I test?
We recommend an annual comprehensive baseline (Optimal or Maximal) to establish your health picture and track year-over-year changes. If you want to monitor progress more frequently — especially if you're actively optimizing or on a treatment protocol — you can add mid-year check-ins after your initial baseline.
What happens after I get my results?
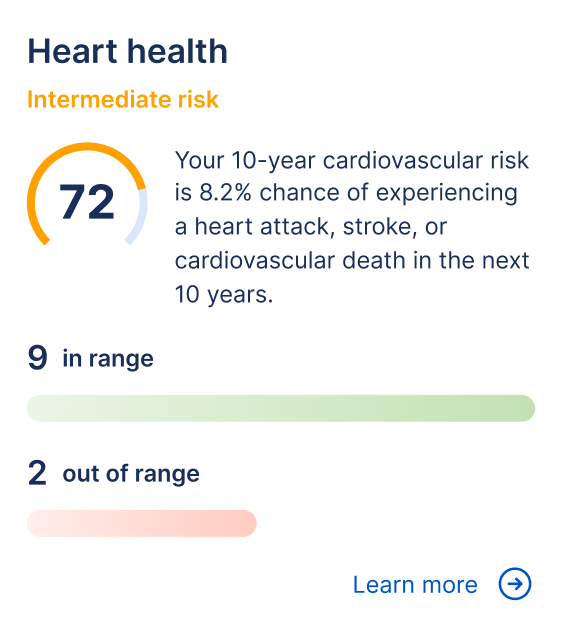
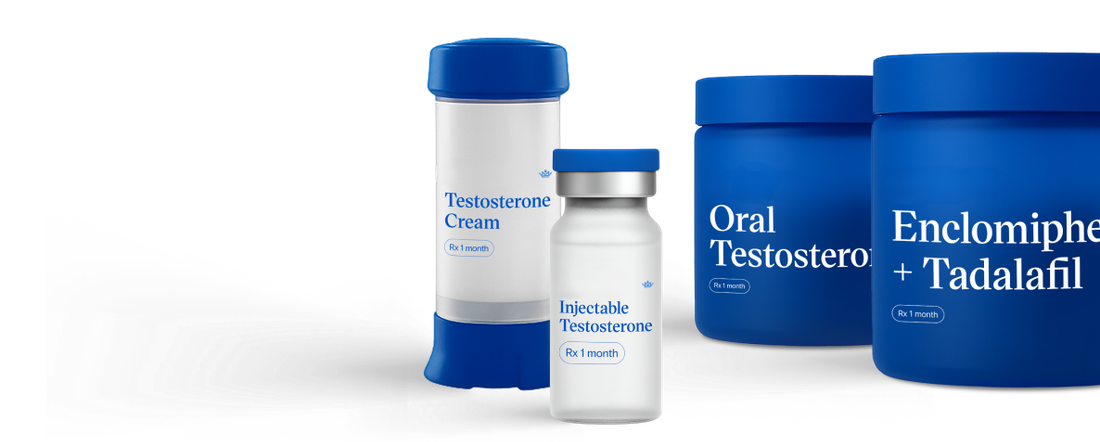
You'll receive personalized health scores showing how your markers compare to optimal ranges, not just standard reference ranges. You'll also get protocol recommendations — including pharmaceutical, supplement, and lifestyle suggestions — tailored to your specific results. If your data reveals optimization opportunities, you can explore Maximus treatment protocols like hormone optimization or weight management.
Do I need to fast before my blood draw?
Yes. Accurate results require fasting for 10-12 hours before your appointment. Water is fine. You'll also need to pause certain supplements beforehand. We'll send you detailed preparation instructions after you place your order.
Where can I get my blood drawn?
You can visit any of our 2,000+ partner lab locations nationwide. After completing your health questionnaire, you'll be able to schedule an appointment at a location convenient for you.
Is lab testing available in my state?
Lab testing is available in 47 states. It is not currently available in Rhode Island, New York, or New Jersey. We're working to expand availability — check back as we add these states in the future.
What if my results show something concerning?
Your results include clear context and optimal ranges for each marker, so you can understand where you stand. If any results are significantly out of range, the laboratory will reach out with appropriate guidance and recommended next steps. We also encourage you to share your results with your primary care physician to discuss any findings that need further attention.
How does pricing and renewal work?
Your panel is an annual subscription. Optimal is $199.99/year and Maximal is $349.99/year. Your subscription auto-renews at your selected panel price. Add-on panels and specialized testing do not auto-renew — they're one-time purchases you can add whenever you want.
Can I add specialized testing later?
Yes. After completing your baseline panel, you can purchase add-on panels anytime — including Autoimmunity, Cardiovascular Health, DNA Mutation Analysis, Heavy Metals, and Vitamins & Minerals. These targeted panels expand your baseline with additional health metrics for specific health areas.
What’s included with my subscription?
Every panel includes: your blood draw at 2,000+ locations, lab processing and analysis, personalized health scores, protocol recommendations (pharmaceutical, supplement, and lifestyle), and on-demand access to your results through our platform. Physician review of your results is included — you get expert analysis, not just raw data.